
Air Quality & Exposure Monitoring System
ESP32 · SPS30 · DHT22 · GUVA-S12SD · TFT LCD · SD Logging
Summary
This capstone project is an ESP32-based environmental monitoring system built to make day-to-day air exposure easier to understand. The device combines particulate matter, temperature, humidity, and UV sensing into one live dashboard. It continuously reads the environment, classifies the current PM2.5 air-quality level, tracks the day’s PM2.5 average and maximum, and provides at-a-glance sensor status information on a color TFT display.
System Overview
The ESP32-WROOM-32D is the controller at the center of the build. Each sensor uses the communication method best suited to it, while the TFT display acts as the primary user interface. USB serial provides an additional debugging and monitoring path to a connected computer.
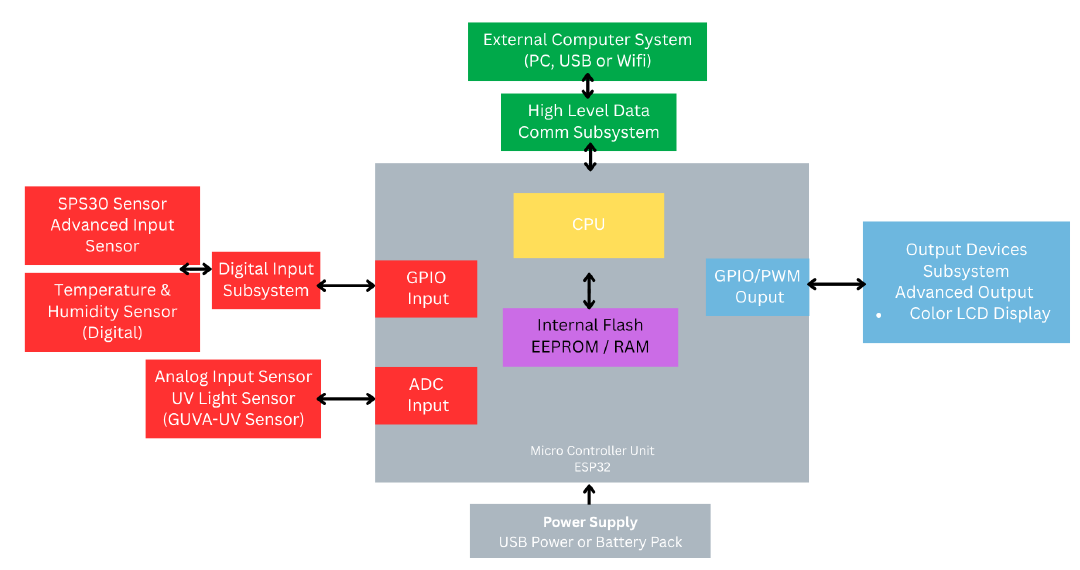
The sensor, processing, display, power, and computer communication subsystems used in the project.
Hardware & Sensors
ESP32-WROOM-32D
The embedded controller that initializes the system, reads each sensor, processes the measurements, updates the display, and handles data logging.
SPS30 Particulate Sensor
Measures airborne particulate matter including PM1.0, PM2.5, PM4.0, and PM10. The final build communicates with the SPS30 over UART.
DHT22
Provides the environmental temperature and humidity readings shown alongside the air-quality information.
GUVA-S12SD UV Sensor
An analog UV sensor used to estimate the surrounding UV level and help distinguish low-UV indoor conditions from brighter exposure.
2.4" SPI TFT LCD
Displays the live dashboard, air-quality classification, daily exposure statistics, and subsystem OK/ERR states.
Storage & Power
The display’s SD interface is used for CSV logging, while the system is powered over USB-C from an adapter or external battery source.
How It Functions
At startup, the program initializes the display, sensors, and SD card before entering its main loop. Sensor values are read every two seconds and the dashboard is refreshed on the same interval. The software processes the PM2.5 measurement into a readable air-quality level, maintains a running daily average and maximum, sends readings to the serial monitor, and periodically logs the data to the SD card.
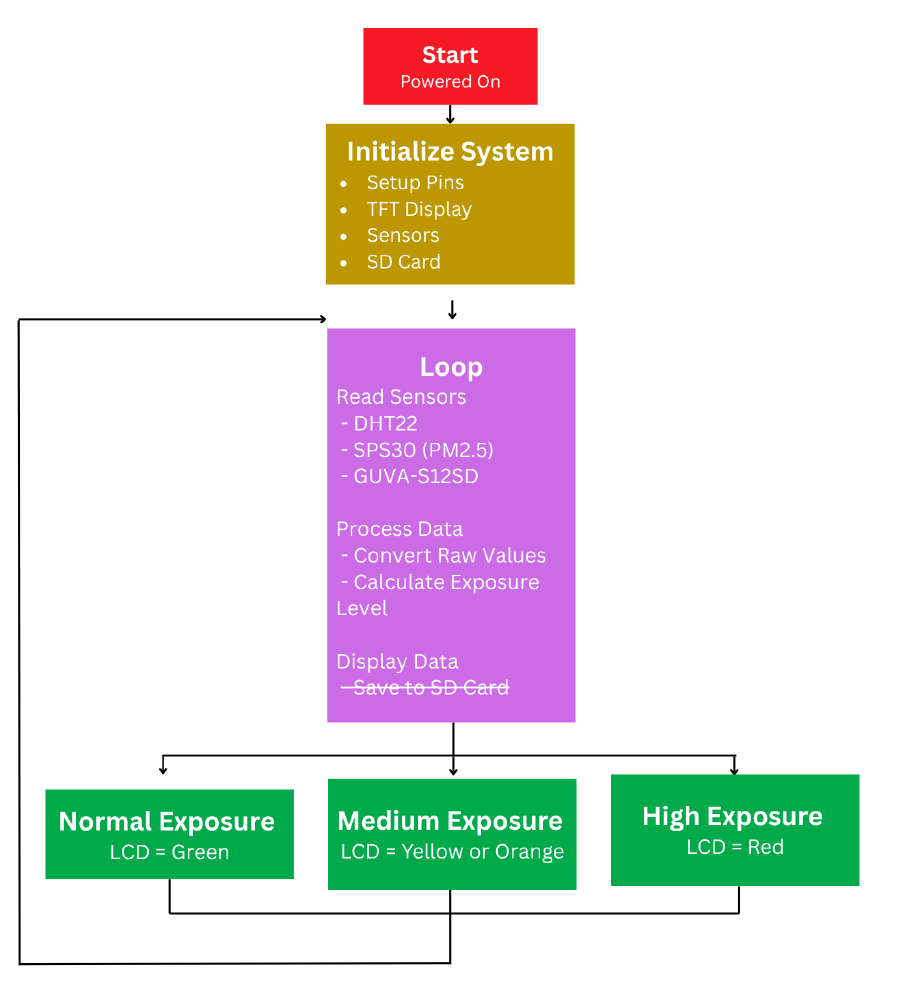
Software flow from initialization through repeated sensor reads, exposure processing, and color-coded output.
Live Dashboard & Exposure Feedback
The display was designed to make the device understandable without needing a connected computer. It shows the current PM2.5 value and classification, additional particulate readings, temperature, humidity, estimated UV index, the day’s PM2.5 average and maximum, and health/status indicators for the SPS30, DHT22, UV sensor, and SD card.
Instead of adding separate physical LEDs, I moved the warning colors into the LCD interface. Good or excellent air quality appears in green, deteriorating conditions shift through yellow and orange, and readings that need immediate attention are shown in red.
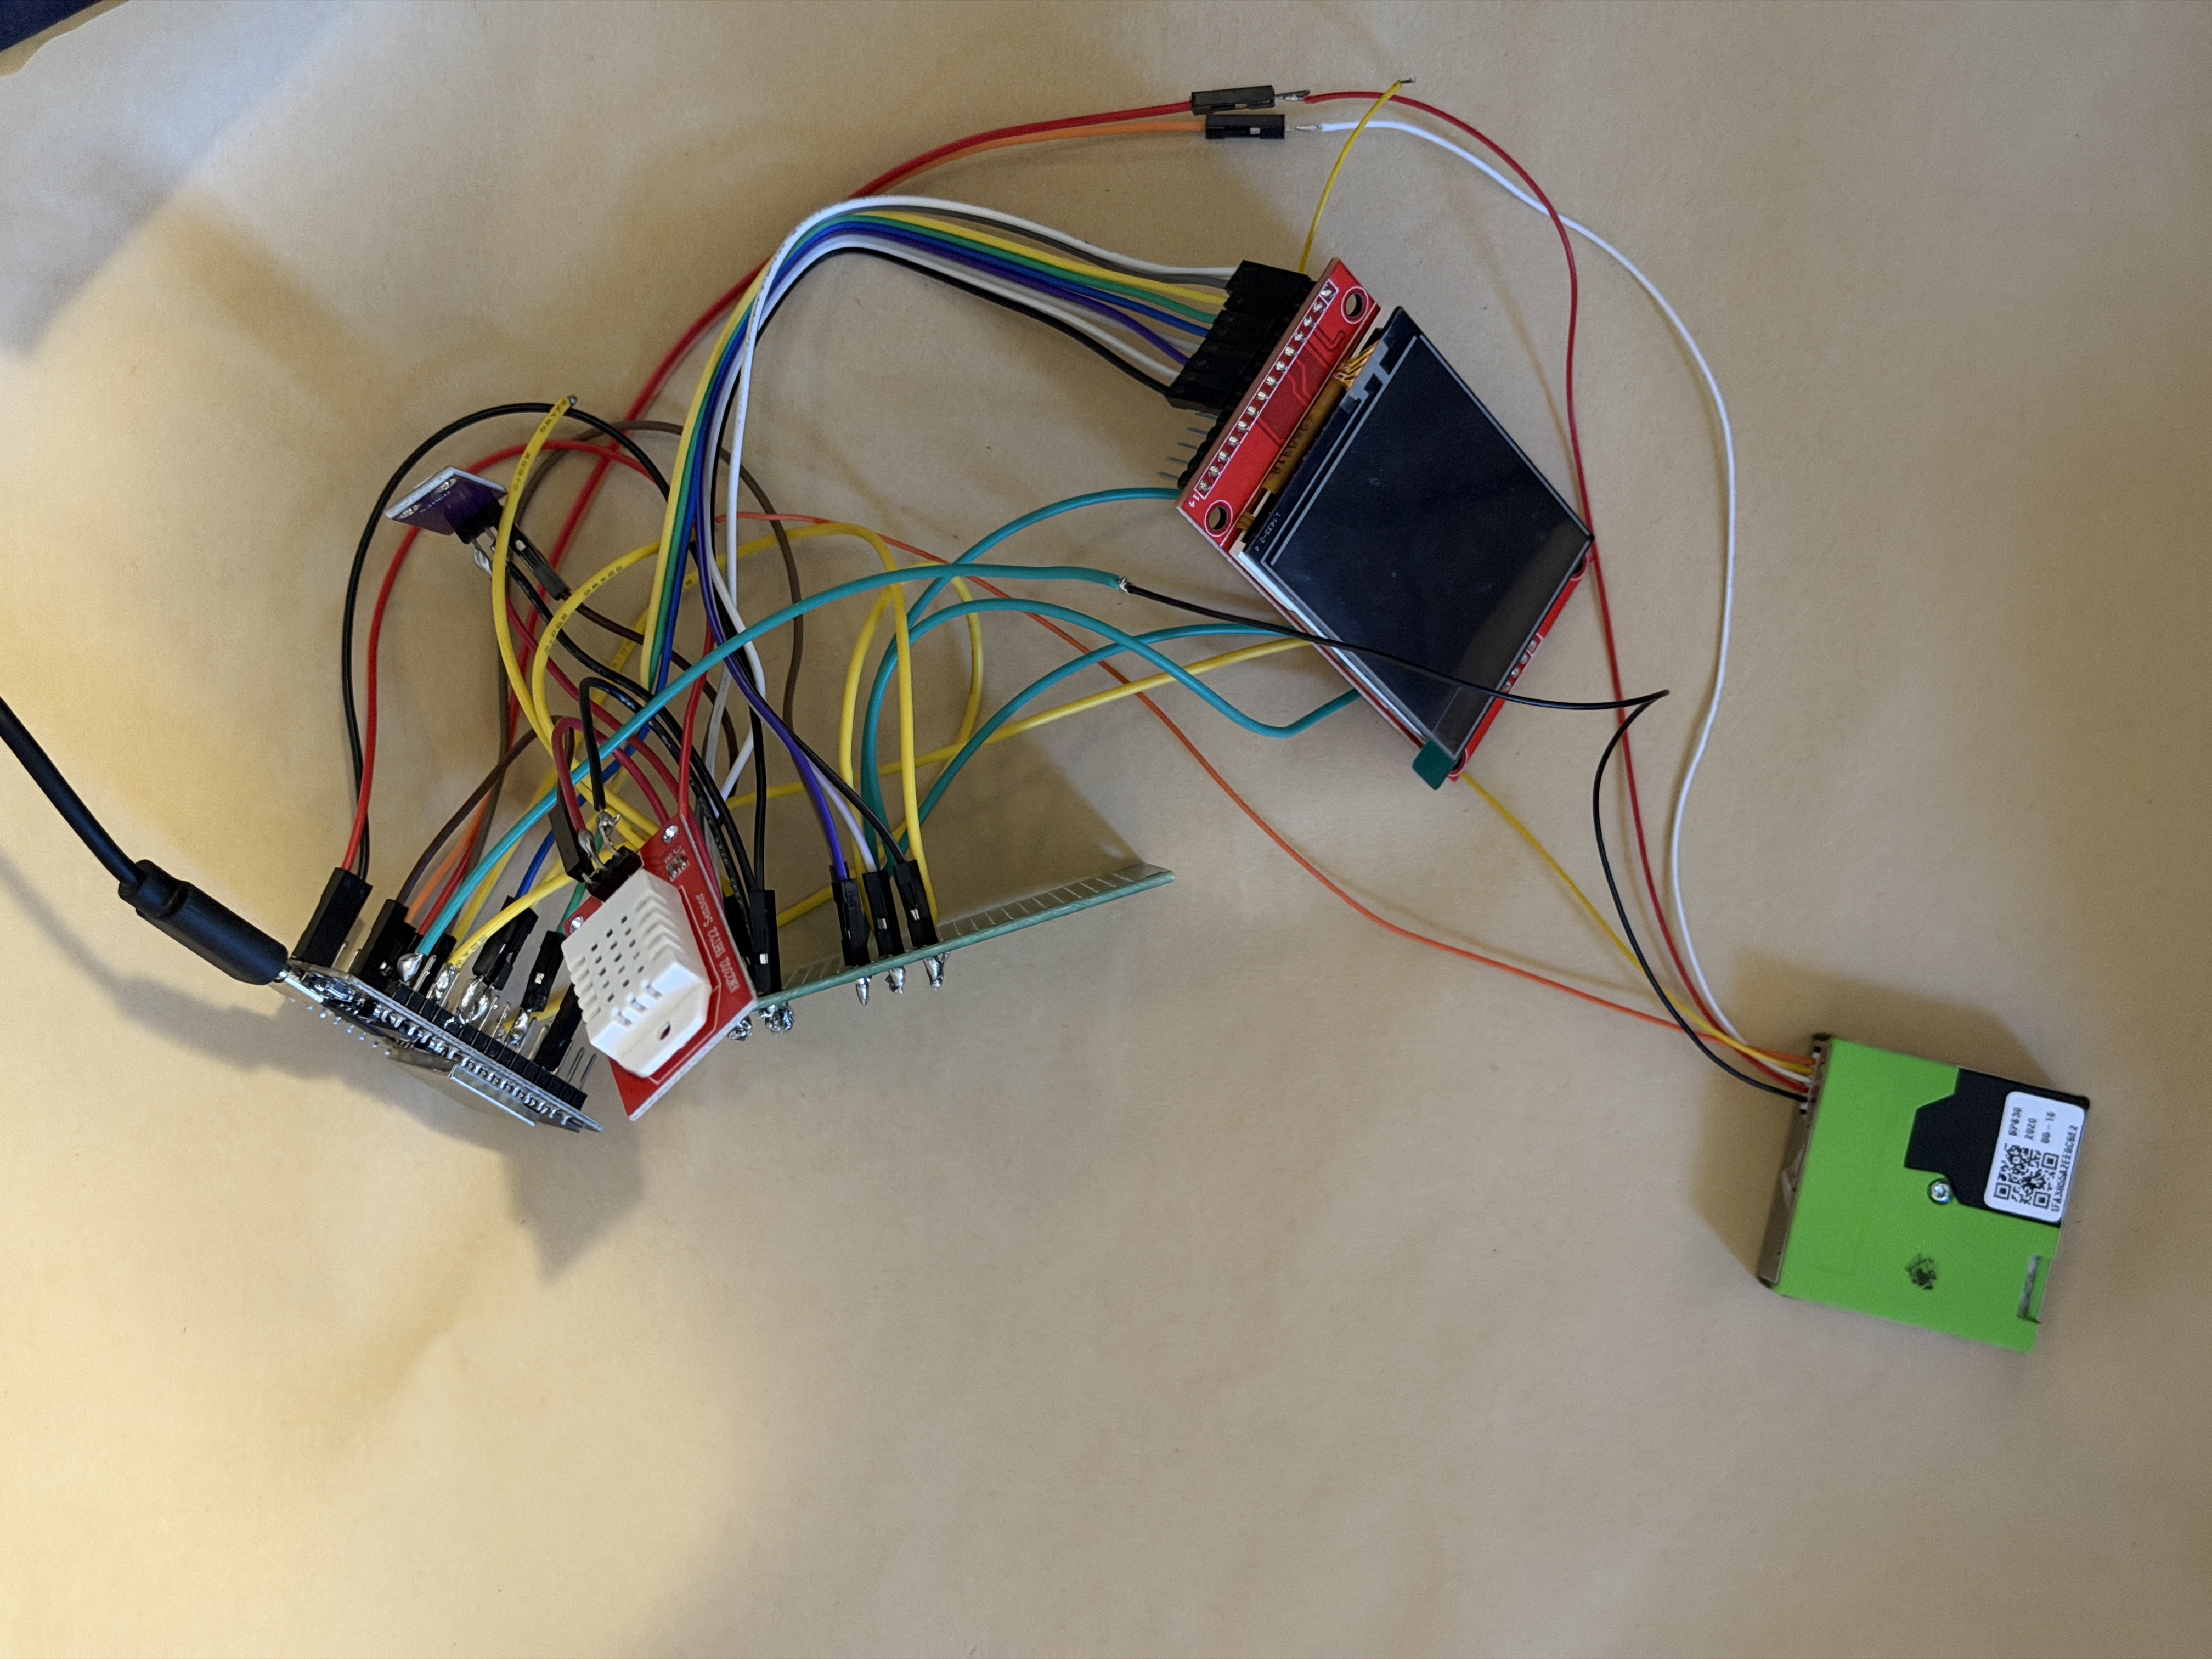
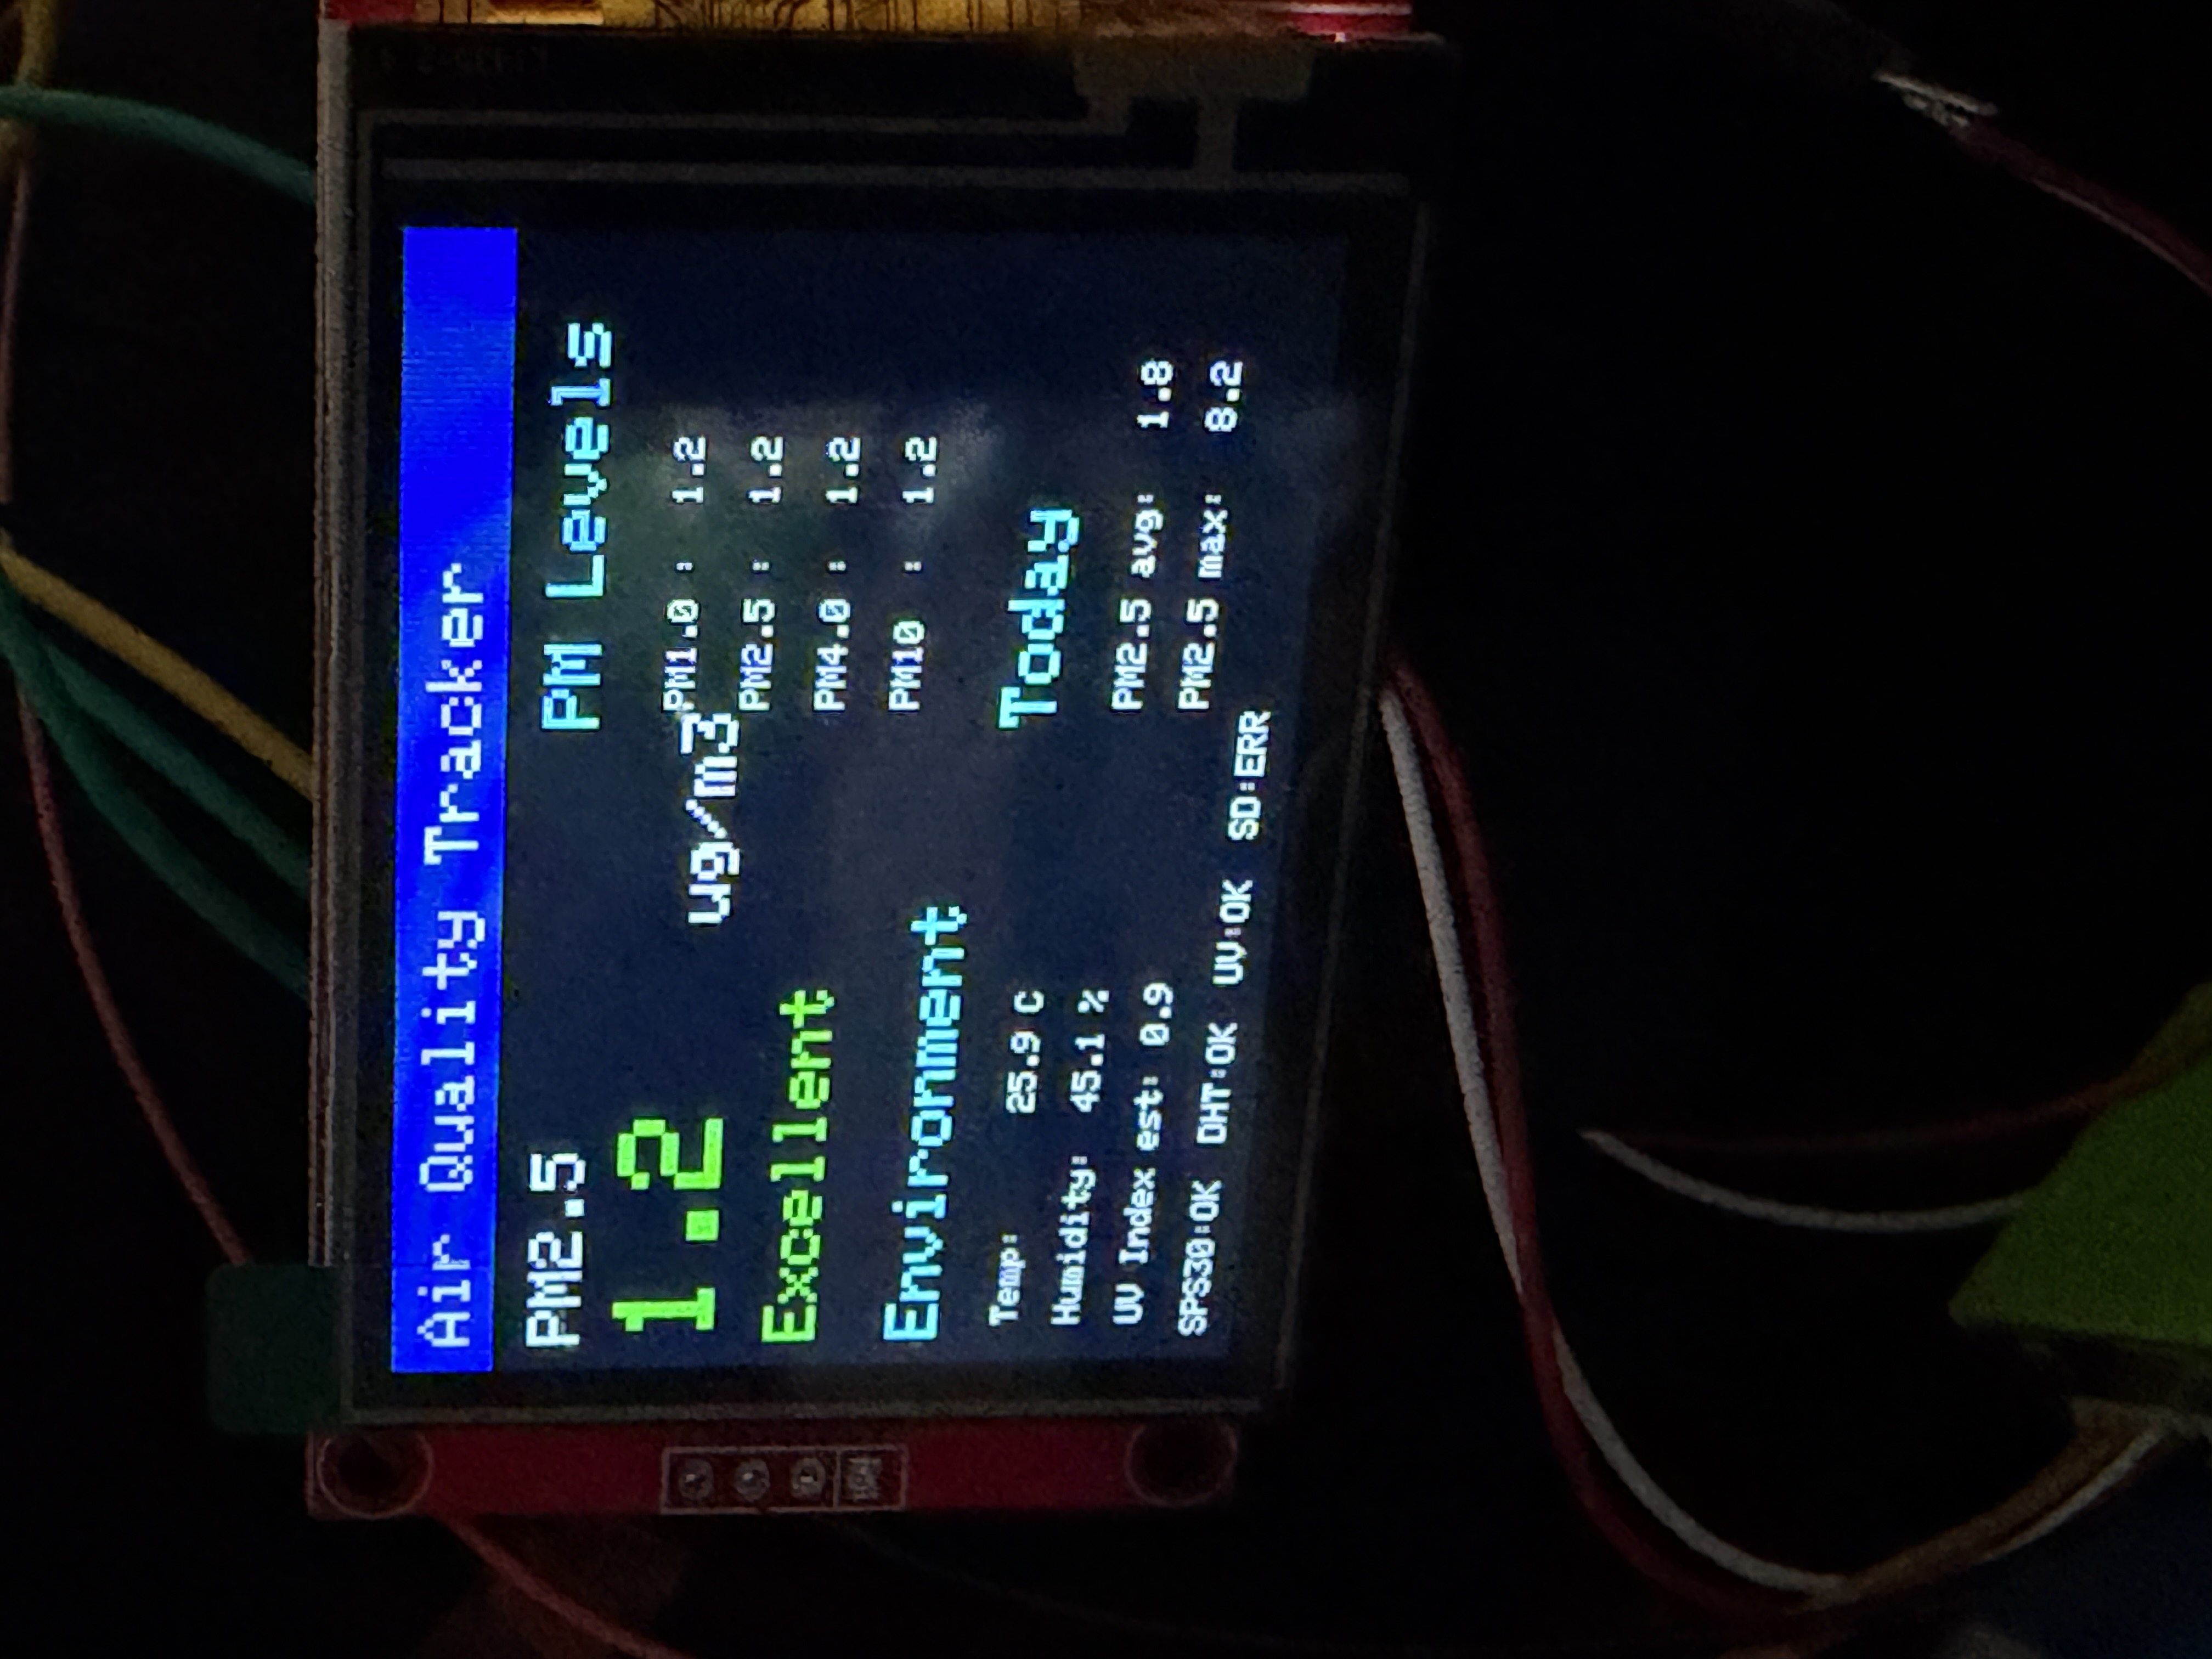
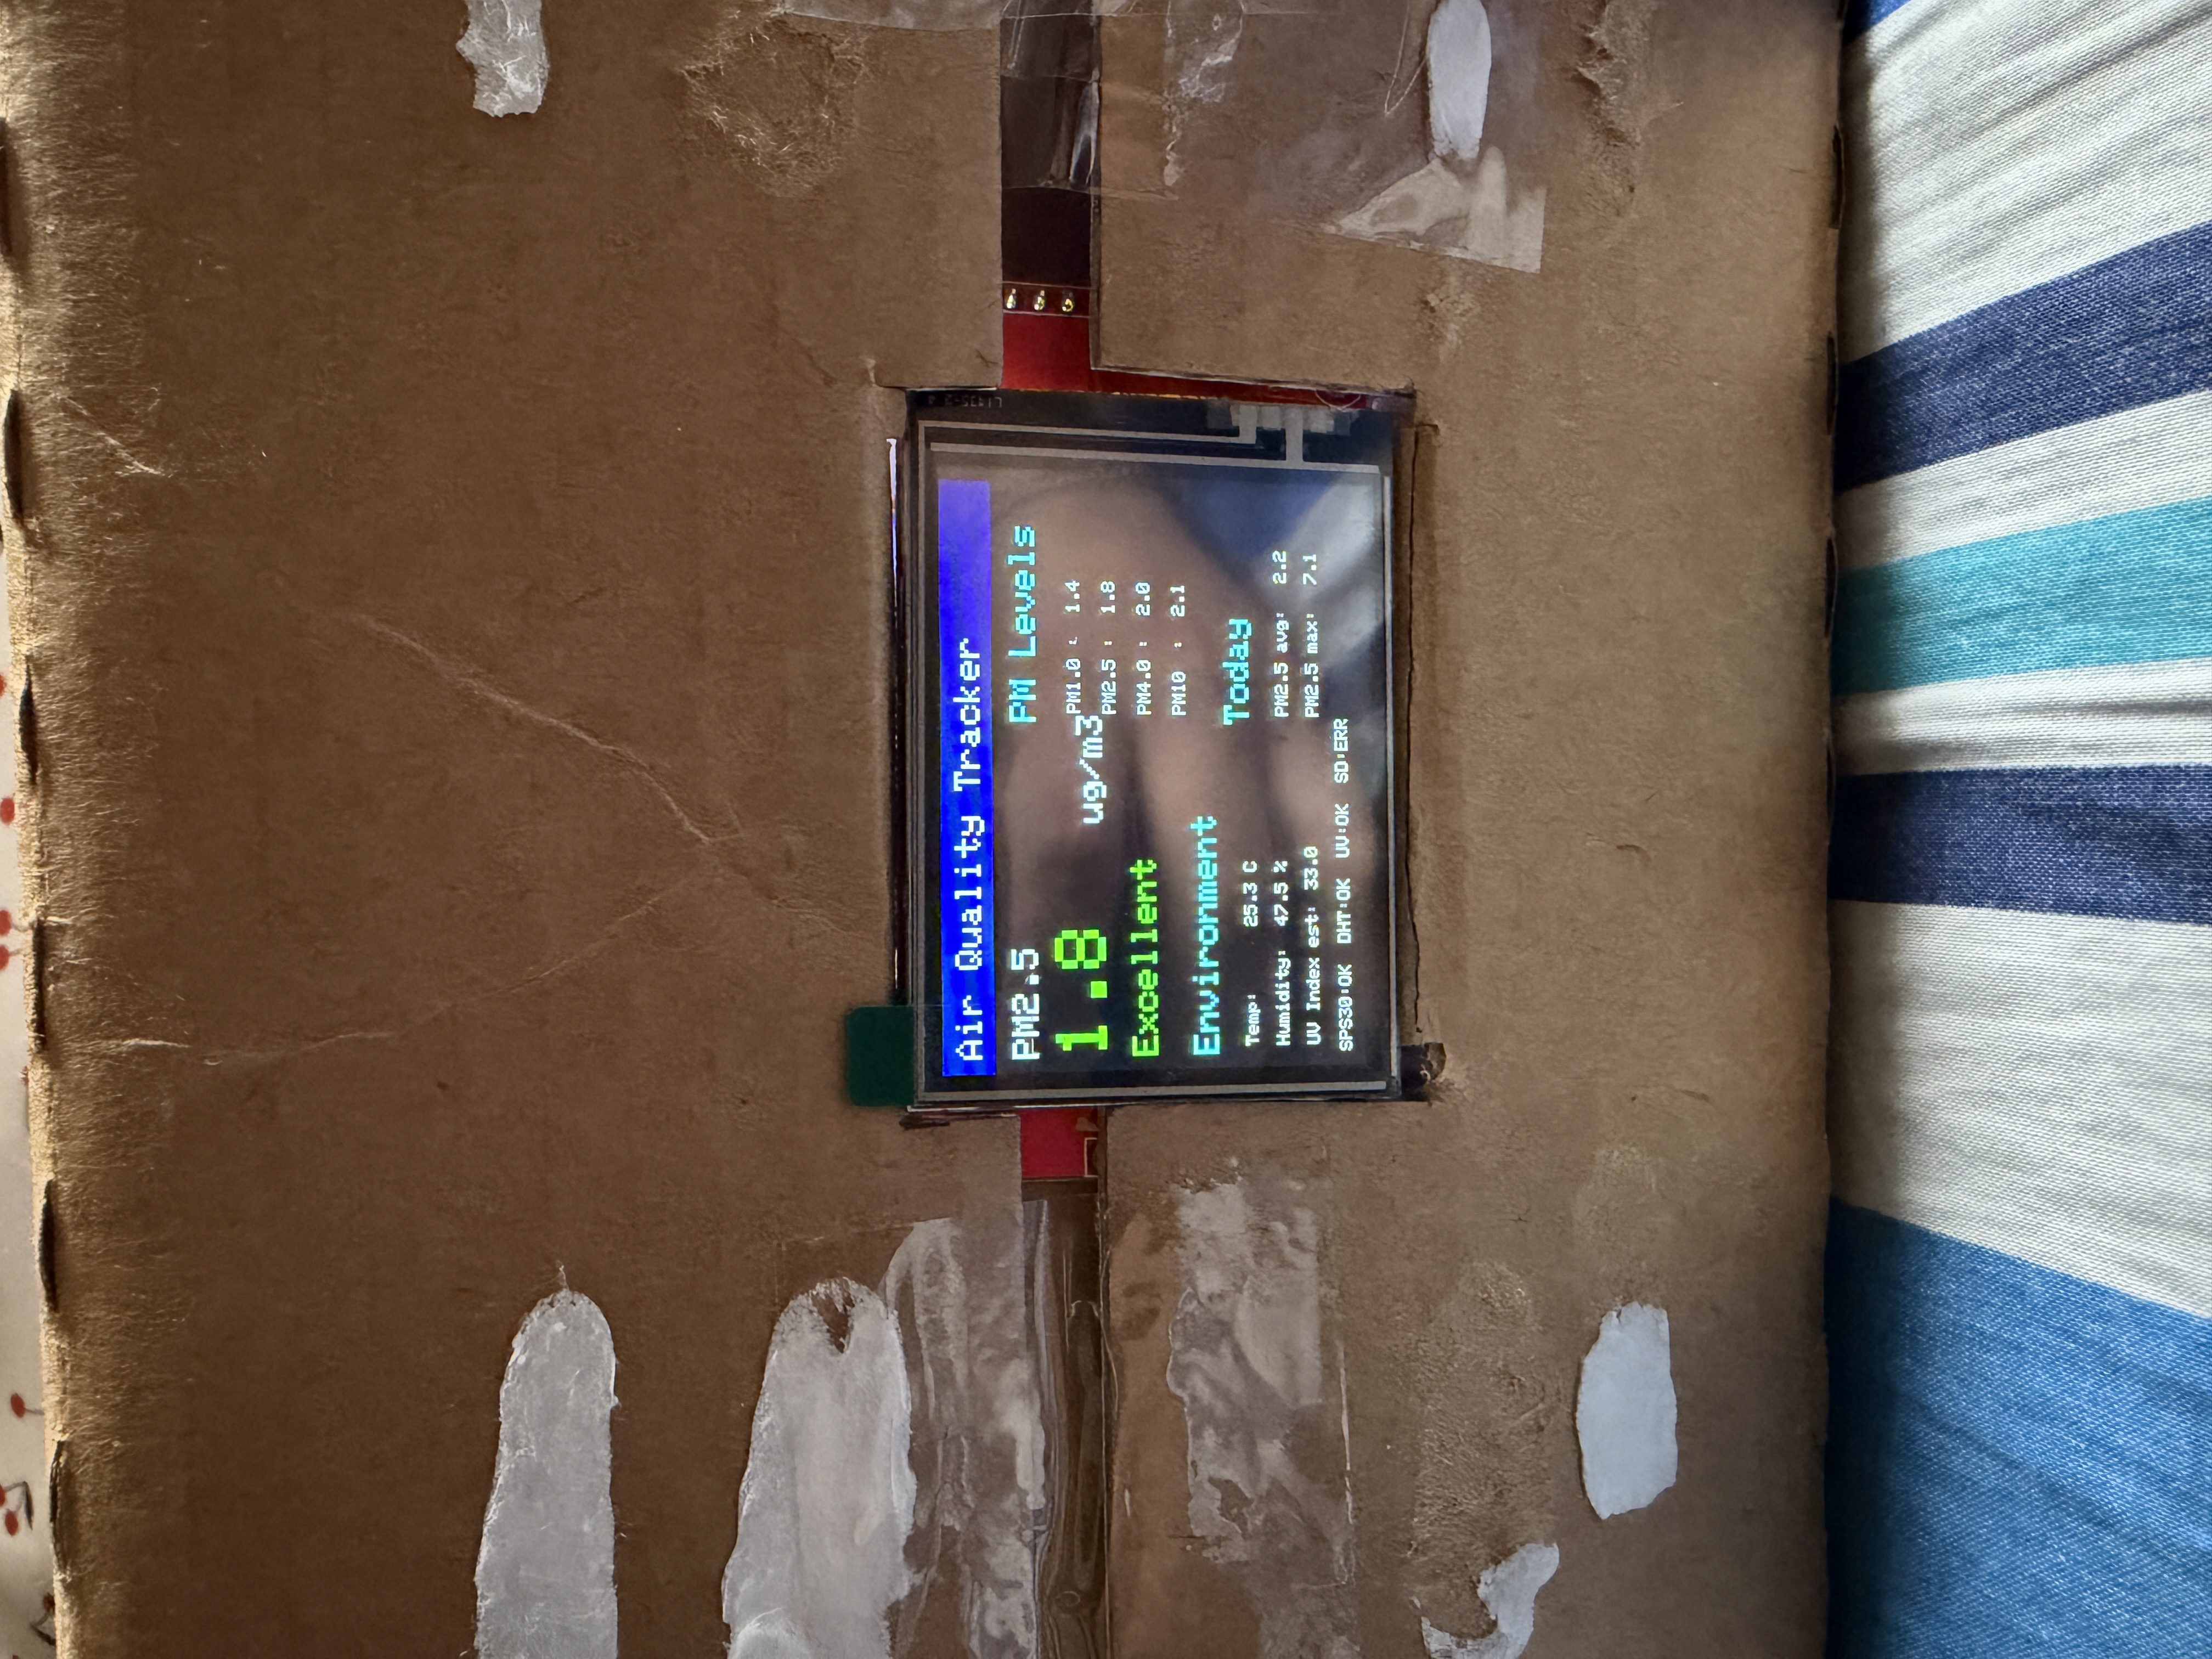
Prototype wiring, the live TFT dashboard, and the final enclosed presentation build.
Communication & Data Logging
- SPS30 → ESP32: UART at the sensor level for stable particulate readings.
- TFT / SD → ESP32: SPI communication for the dashboard and removable storage.
- DHT22 → ESP32: single-wire digital sensor communication.
- GUVA-S12SD → ESP32: analog voltage read by the ESP32 ADC.
- ESP32 → PC: USB serial output for readable live values and troubleshooting.
- CSV logging: readings are saved to the SD card with particulate, environmental, UV, daily PM2.5, and sensor-status fields.
Build & Troubleshooting
The final system came from several rounds of hardware and software troubleshooting. Early DHT22 instability was traced to a poor solder connection and corrected. The SPS30 was initially wired for I2C, but the connection proved unreliable, so I rewired it for UART operation and corrected the TX/RX orientation before receiving consistent particulate readings.
The original concept also included separate LEDs and a buzzer. I removed those parts from the final build and integrated the air-quality warning colors directly into the LCD, reducing extra wiring while keeping the visual feedback. The finished prototype was placed in a custom-cut enclosure to demonstrate the project as a self-contained product.
Current Limitation
The software treats one operating session as the start of its 24-hour “day.” If power is disconnected, the running timer and daily exposure tracking restart because this version does not retain real-world time across power cycles.